A collection of reports can help you choose what to test next. It does not become a universal profile because many people posted it, and a high share of favorable posts does not establish a success rate unless the eligible records and missing outcomes are known. Start with a specific question, define what records could answer it, and keep unlike evidence separate.
Define the question and the unit
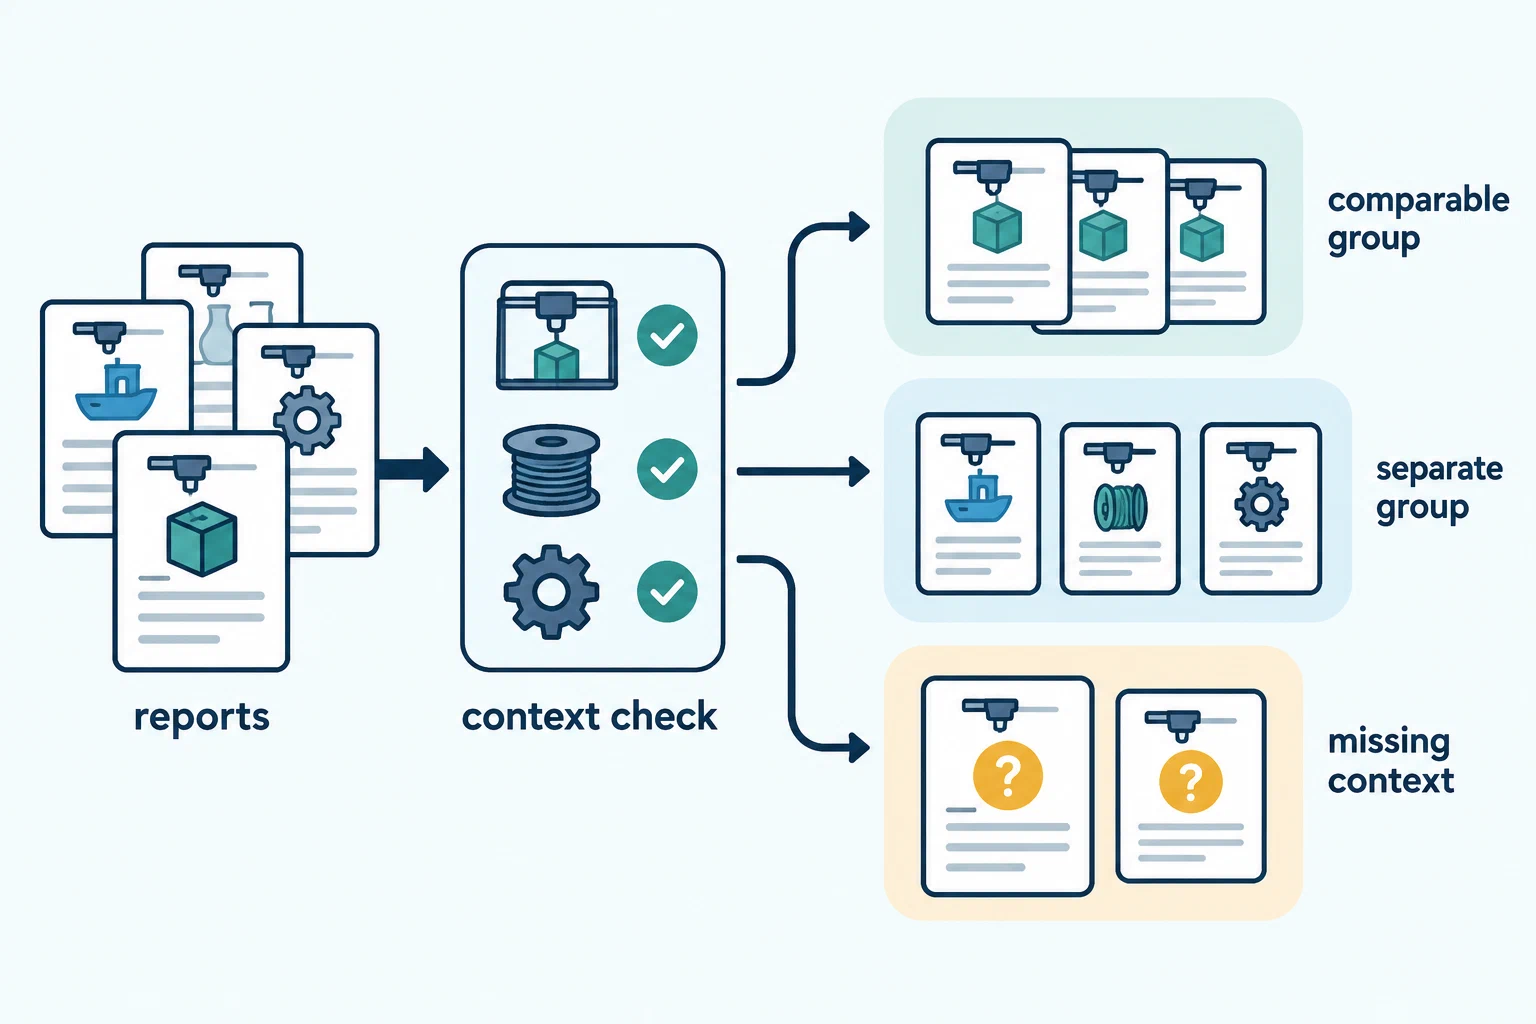
Ask what you want to learn: whether a named setup repeats a measurement, whether a change is worth testing, or whether a symptom appears under a stated context. Decide whether the unit is a report, setup, print run, specimen, measurement, or platform event. One post can describe multiple runs; several measurements can come from one specimen; reposts and copied records are not independent setups.
Before pooling results, record the fields that matter to the question:
| Grouping field | Check before combining |
|---|---|
| Machine and state | Printer model and variant, firmware or controller context, nozzle and plate |
| Material | Vendor, product or formulation, color or grade when relevant, dry or conditioned state |
| Configuration | Slicer and release, selected presets, effective values, output changes, and relevant overrides |
| Object and method | Geometry, orientation, specimen or feature, measurement method, instrument, units, and comparator |
| Operating context | Maintenance, operator, environment, treatment, exposure, or remote-job stage when material |
| Record state | Attempt number, duplicate or copied version, missing fields, correction, exclusion reason, and follow-up status |
Do not hide a changed condition inside a broad label such as “same printer.” If a context differs in a way that could affect the outcome, stratify it, report the difference, or exclude it from that specific comparison with the reason. Keep the original count available.
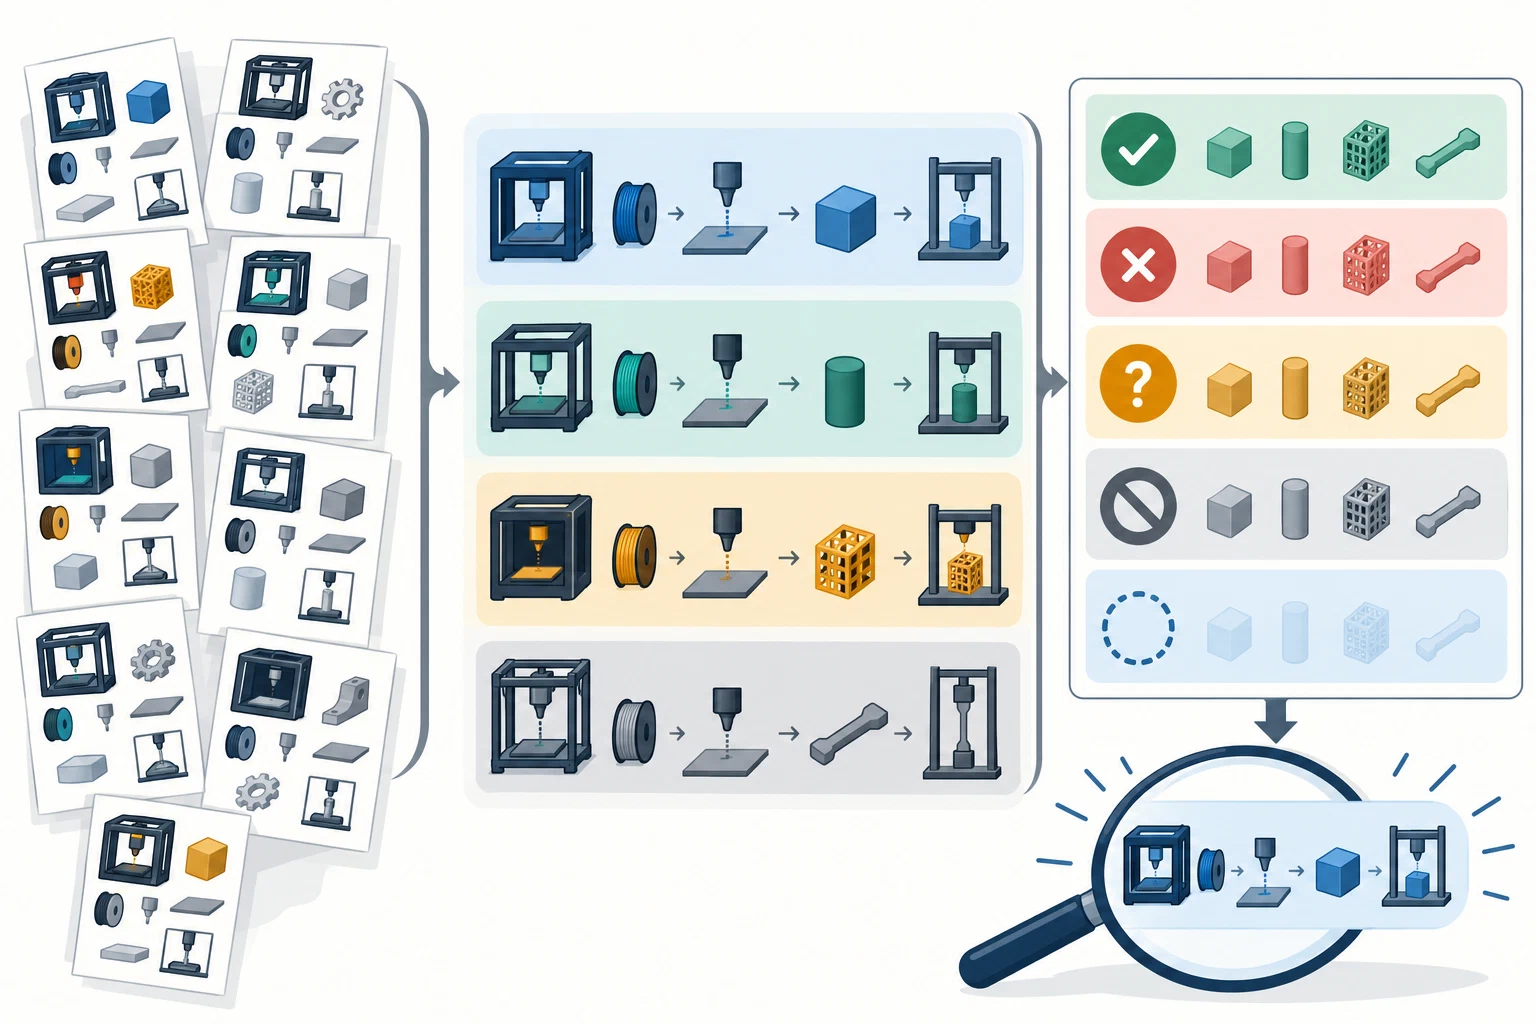
Show the denominator and every outcome state
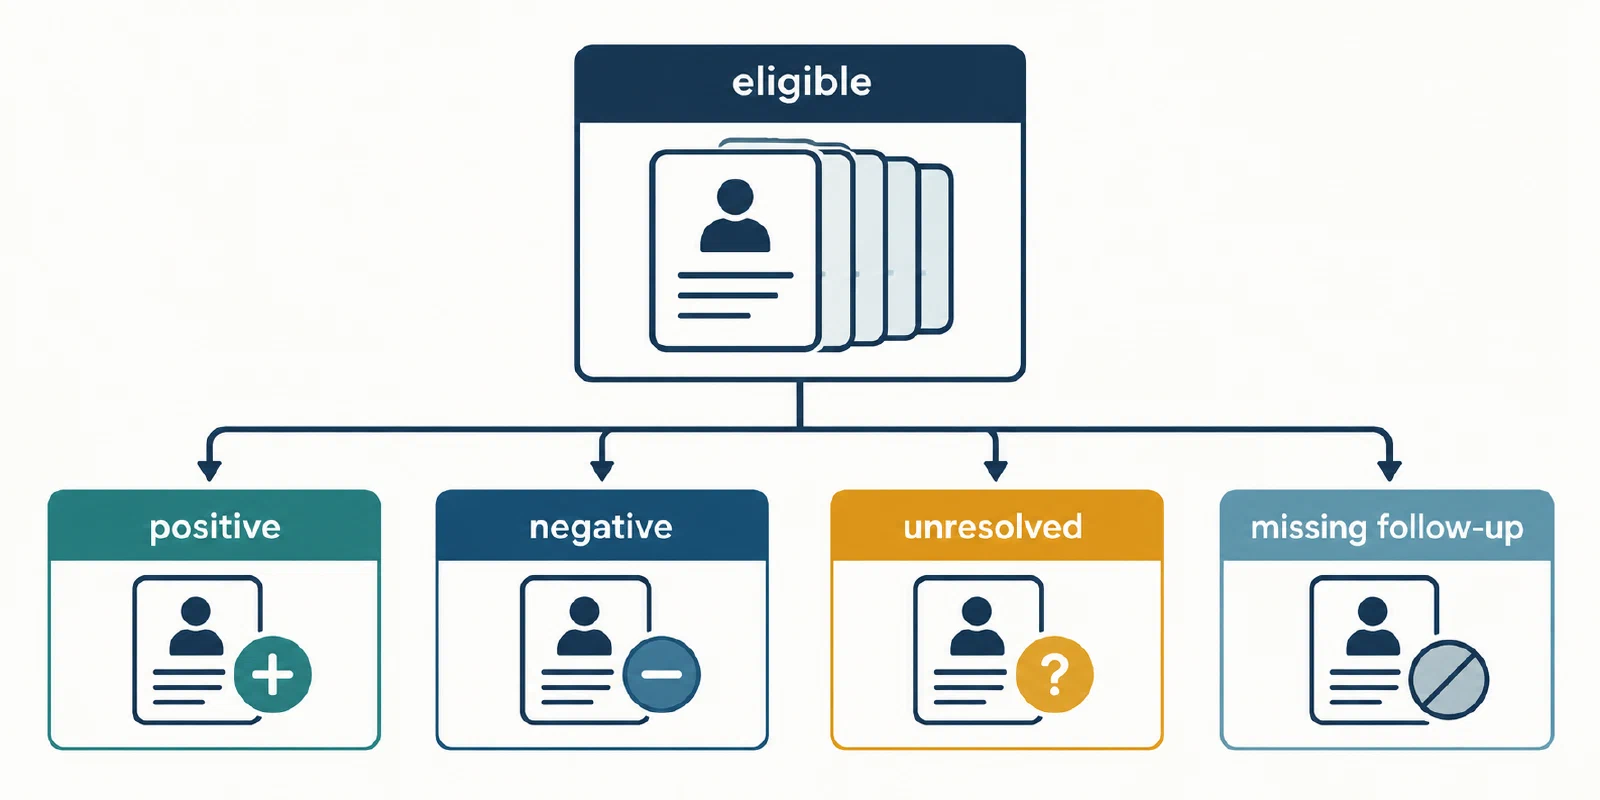
For each group, state how many eligible reports, distinct setups, runs, specimens, and measurements are represented. Then show positive, negative, unresolved, excluded, and missing-follow-up counts against the denominator relevant to that statement. A result with no reply is unknown; it is neither a success nor a failure. A removed record is not an outcome unless the reason is documented.
Keep measurements with compatible quantities, units, objects, and methods together. A photo, subjective label, sensor estimate, model prediction, download, “make,” confirmation, or like is a different kind of record from a measured feature. Preserve those signals as their own fields rather than adding them to a physical success count. Report the spread and method when the data support them; a single average can conceal incompatible setups or disagreement.
An example of why denominators need inspection: FixMyPrint’s July 2026 first-layer article introduces nearly 1,900 outcomes under the label “confirmed,” while its eight listed material rows total 3,199. The publisher’s methodology defines its calculated success-rate pool as Bucket A, direct original-poster confirmations, plus Bucket B, highest-voted community fixes without direct original-poster confirmation. The first-layer article does not show how those buckets map to its figures. Treat “confirmed” here as the publisher’s label, not as evidence that every outcome was directly confirmed or independently inspected. The headline and row totals also remain unreconciled; neither supplies a usable denominator for a rate.
Published catalog coverage is also different from user outcomes. A 2026-10-10 material-summary snapshot can report how many catalog entries have complete, partial, or unavailable test modules and how many scores exist. That describes the publisher’s catalog state. It does not show how often a material succeeds across a population of printers. A publisher-defined score needs its own scale and method; an internal confidence indicator explicitly described as not being a 95% confidence interval is not a formal interval.
Work through a clearly hypothetical example
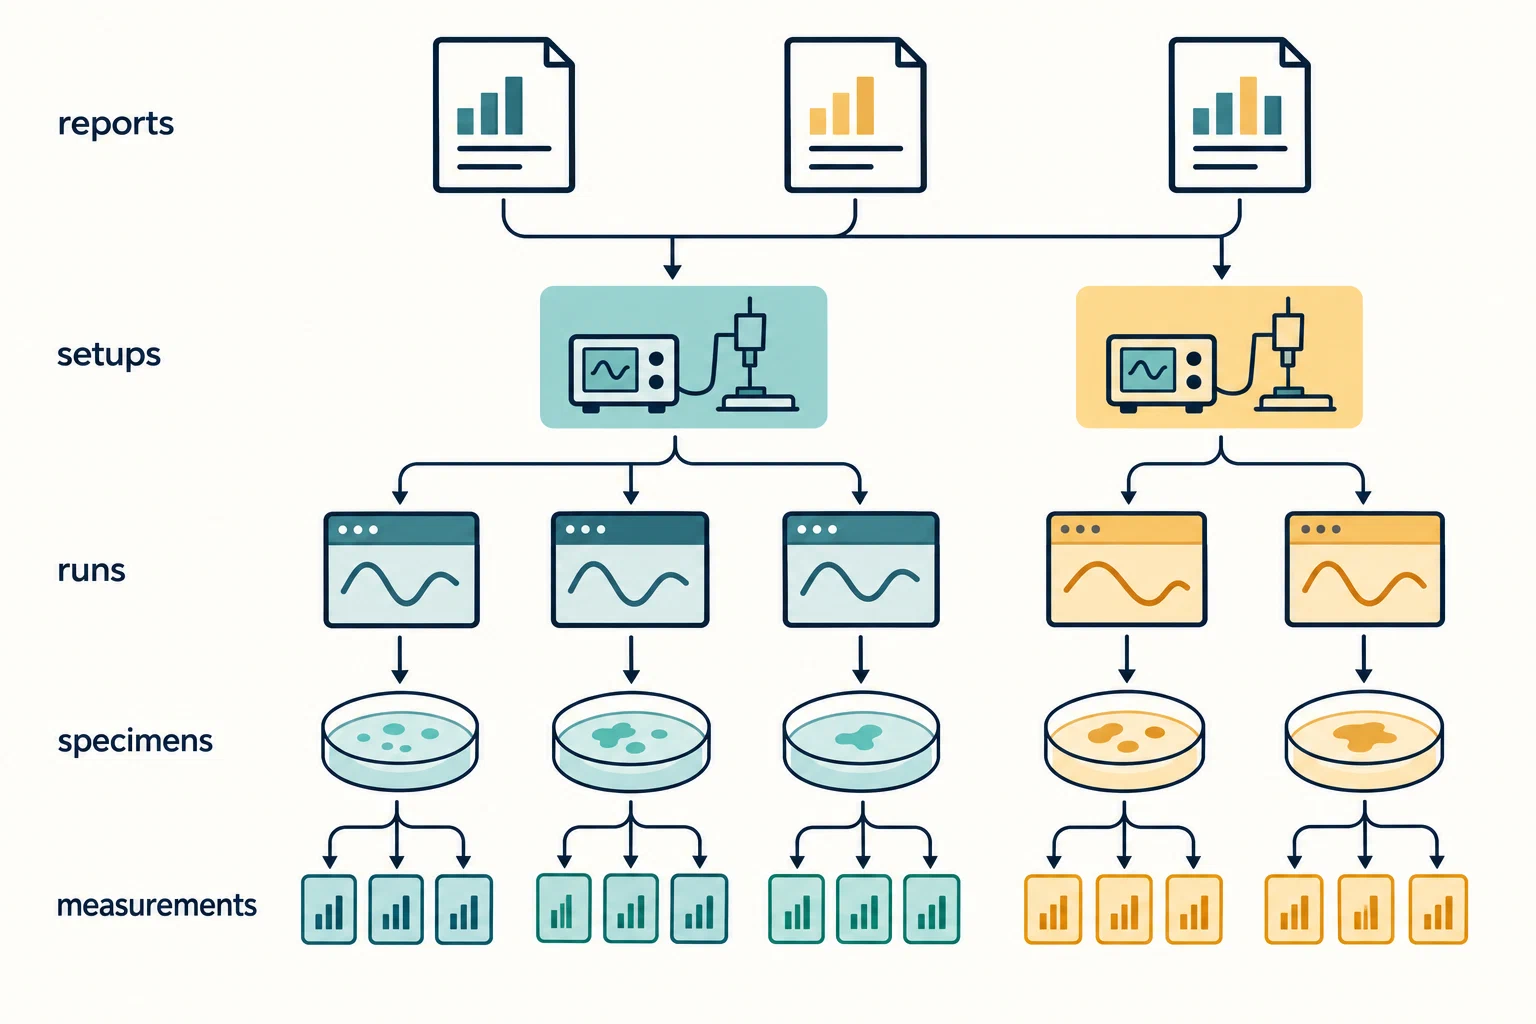
The following numbers are illustrative only; they are not a sample target, threshold, or empirical result.
| Group | Records | What can be discussed | What remains unsupported |
|---|---|---|---|
| Setup A: one printer, same nozzle, material, slicer release, geometry, and measurement method | Three separately identified runs, each with a measurement | The spread among these repeats on this stated setup | Reproduction on another printer or a general success probability |
| Setup B: two other printers, with a different nozzle and slicer release | Two runs, one per printer | A separate descriptive account of those changed setups | Attribution to the nozzle or slicer, because more than one condition changed |
| Follow-up missing | One submitted run has no final observation | The follow-up is unknown and should remain in the eligible-record accounting | Counting it as either a pass or a failure |
If the reader’s question is repeatability under the Setup A measurement conditions, keep its three runs together and state the method. If the question is reproducibility after conditions change, list the changed conditions and treat Setup B separately unless a suitable comparison design supports a stronger conclusion. NIST uses repeatability for measurements under the same conditions and reproducibility when conditions change; the changed conditions should be named.
An NIST additive-manufacturing pilot found relatively consistent geometric results within individual tested printers but significant between-printer variation. It is a bounded historical study, not a representative survey of current consumer printers. Its useful lesson here is to preserve printer pedigree and investigate variation, not to transfer a universal cutoff or expected rate to a community dataset.
Investigate unusual results and choose a next check
Do not delete an unusual value merely because it is inconvenient. It may be a recording error, a different setup, an invalid method, or a meaningful result. Follow the source method: inspect the record, preserve the original value, document any exclusion and reason, and compare conclusions with and without a questionable point only when the assumptions support that analysis.
A useful aggregate ends with a bounded hypothesis and a next check, such as repeating a measurement on the same identified setup or comparing a controlled change under applicable calibration guidance. It does not prescribe a universal sample minimum, rank printers from uncontrolled submissions, or establish causality from frequency. For the individual contribution, see sharing a reproducible result ; for a disputed or corrected record, use failed results and corrections .
Back to top ↑